Sometimes, you want to check out how your application is
structured at runtime. All those nested controls and elements can
be hard to visualize when working in code, markup, or designer.
Sometimes you need to see the applied values from styles (this is
one thing I use IE and Firefox dev tools for with HTML/CSS all the
time) Sometimes, you want to just ... er... borrow someone else's
ideas. :)
Wait. Why would I ever need a runtime visualizer to figure out
my WPF visual tree. It's pretty simple, right?
Umm, yeah:
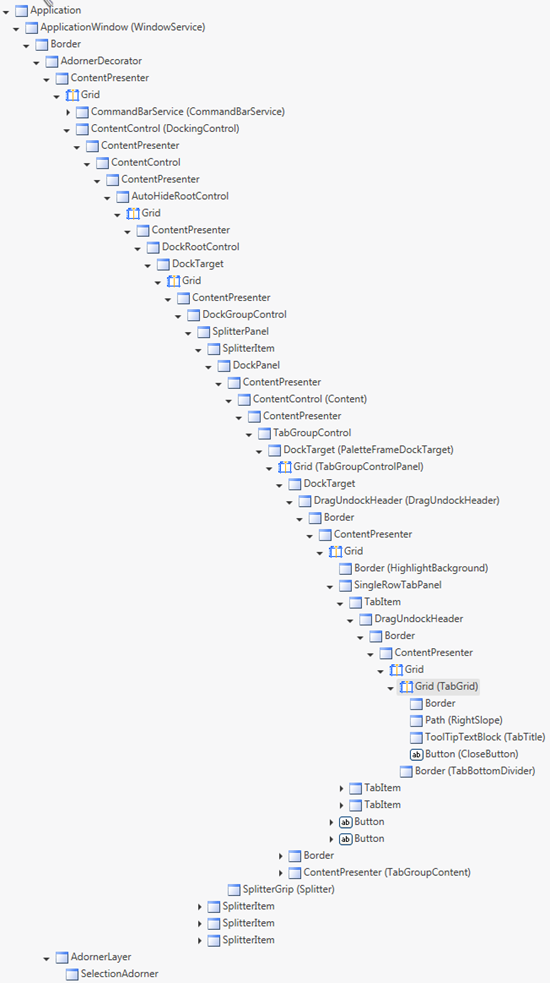
So, a tool can definitely be helpful :)
There are three great WPF runtime inspection tools for the community,
by the community. The first is Mole, written and maintained by Karl Shifflett
and Josh Smith. The second is Snoop,
originally written by Pete Blois and later taken over by Cory
Plotts. (as an aside, you can see my MIX10 video interview with Cory on channel9)
The third is one that I didn't know about until recently: Christian Moser's WPF Inspector. As Mole
doesn't currently support .NET 4 or VS2010, we'll cover just Snoop
and Inspector in this post.
Both applications install as ClickOnce WPF apps. Both, if you
get the latest release of Snoop) will handle 32 and 64 bit
applications. Their UI/UX approach is quite different, though, and
both have strong points. When helping Long Zheng with some WPF
challenges in MetroTwit, I relied heavily on Snoop to figure out
what was going on. Let's go back through that app with both
tools.
Keep in mind I'm comparing an app in its 2.6 version
(snoop) with an application in beta. Take anything that smells like
a comparison (which would be this entire post) with a grain of
salt.
Installation
Both had simple and professional installers that ran without
issue.
Main UI
Snoop uses an "always open" toolbar metaphor. WPF Inspector uses
a regular dialog metaphor.
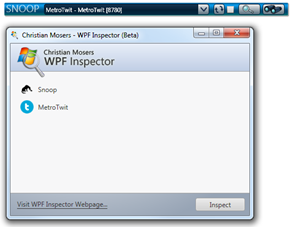
Either UI works for me. I usually open this type of application
for a specific session, then close it afterwards. I also have
multiple monitors including one big 30" display, so I'm good on
screen real-estate. If you have a small screen, UI differences like
this may matter to you.
Snoop provides a process ID which is somewhat helpful if you
have more than one instance running.
TIP: To figure out your app's process id, open task manager
(taskmgr) and look at the process tab. While doing that, move your
app around the window using the mouse. The instance with the raised
CPU usage is the app you're using.
Application Detection
- WPF Inspector identified Snoop and MetroTwit, but didn't
identify Visual Studio
- Snoop identified WPF Inspector, MetroTwit and Visual
Studio.
Now, I can't think of any reason why I'd want to snoop/inspect
Visual Studio, but the minor difference is there. One minor but
nice difference is that WPF Inspector identifies newly opened apps,
whereas Snoop requires you to hit the refresh button.
First Inspection/Snoop Screen
Where do you land once you pick an application?
When you select an app using WPF Inspector, you are presented
with this screen:
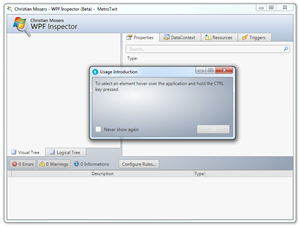
The white-on-gray button in the dialog needs to change :)
Do the same in Snoop, and you get this screen (I expanded the
tree a little)
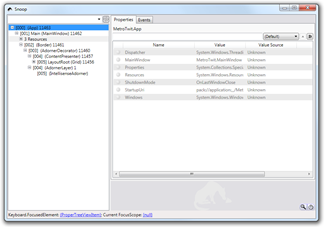
Now, WPF Inspector didn't give me any info on the application.
It may be due to the window structure of the MetroTwit app (it's
doing some cool things to get the drop shadow, more on that in
another post), but snoop was able to pick it up.
Snoop has a UI feature I find annoying. I guess it could be
useful to some, but when you have multi-monitor it's a bit of a
pain: when you click the application, the snoop UI is brought up
with it. The snoop icon in the taskbar applies only to the snoop
toolbar, not the UI. I'd prefer Snoop to behave like a normal
application.
Similarly, WPF Inspector shows no icon in the taskbar. It's easy
to lose the app, as it doesn't appear when I focus the application
either. Again, perhaps just the result of the app I picked.
In both cases, I want a separate taskbar
icon.
Visualization Take 2 - Switching Apps
So, given what I ran into with the other apps, I decided to
switch apps. I'll talk with Christian to see what was up with WPF
Inspector.
I cracked open Expression Blend 4 and got WPF Inspector to show
me some goodness (tree manually expanded here too):
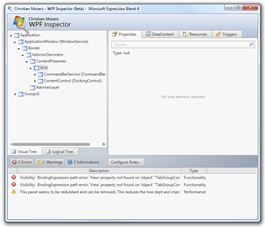
Both applications have great tooltip hover goodness, showing a
preview of what is in that node of the tree. Love it. Look closely
at the WPF Inspector. You can see Snoop in there. It's pretty
interesting to be inspecting snoop snooping the app your
inspecting. Pretty sure that will cause a wormhole to open sooner
or later.
NOTE: I closed WPF Inspector during this post and re-opened it.
It could no longer find the elements in Blend, so there's
definitely some things going on in there. It's beta, after-all.
It's also interesting that when you hover over one or the
other's tree, WPF Inspector shows a "PopupRoot" coming in and out
of the tree, indicating a popup control. The WPF inspector is
dynamic, the Snoop inspector is static, based on a snapshot of the
application.
Static vs. Dynamic UI
The WPF inspector is always showing the UI as it exists in that
point in time. Snoop takes a snapshot at the beginning. That means
for a complex dynamic app, you'll need to refresh snoop.
This sounds like a point in WPF Inspector's favor, and it can
be. However, when inspecting something like MetroTwit, where the UI
is being rebuilt on a regular basis as new tweets come in, I
imagine this could be pretty frustrating. I wasn't able to test
this scenario in WPF Inspector as it wouldn't inspect MetroTwit, so
I'm working on assumption here.
Snoop does show changes in property names, just not changes to
the visual tree without a refresh.
Both apps provide a good view of the visual tree. One thing I
like about WPF Inspector, is it will also show you the logical
tree, a much trimmer view which helps you avoid that monstrosity of
a tree I opened with.
Blocking vs. Non-Blocking
Snoop has its UI blocked when the Blend dialogs were open. WPF
inspector remained available. I believe this has to do with how
Snoop injects itself into the tree of the process you're
inspecting.
What does that mean? Well, at least when working with Blend, I
couldn't use the Snoop UI when Blend had a modal dialog up. Most of
the time that's not a big deal...unless you want to inspect a
dialog.
Modifying Values at Runtime
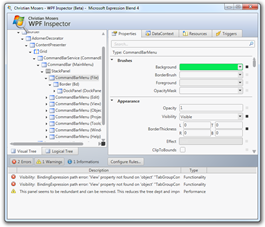
Now the best part. This looks pretty promising in WPF Inspector:
changing values in real time.
WPF inspector let me change the values of elements in real time.
I made the menus in Blend Green, for example:
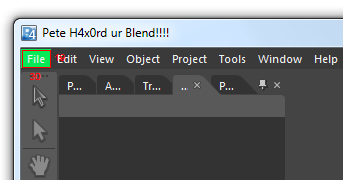
(and yes, I changed the app title. Feel the power!! Muah
hahahaha)
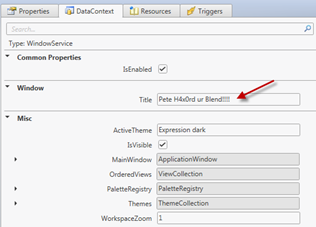
One thing I don't like about the property inspector, however, is
how it sometimes disappears when you move focus to another
application (such as when writing a blog post). Maybe not an issue
during normal usage.
Debugging
Snoop has support for setting breakpoints on properties. I've
never used this function.
Keyboard and Mouse Selection
Snoop also allows you to see what items are focused with the
keyboard or mouse. This makes it easy to navigate around the visual
tree by clicking on items in the application.
I didn't get to try it out, but WPF Inspector will let you
select elements by mouse hover. Also a time saver.
Compilation Rules
The rules / errors pane in WPF Inspector is also nice. Time will
tell how useful this is in real applications, but it looks
promising.
UI Visualization
This is one place where Snoop shines. Snoop has a nifty 3d
visualizer that lets you see the full UI in a blown-out 3d mode. If
you have lots of panels and need to visualize the z-order, this is
really helpful. If not, it's just cool eye candy :)
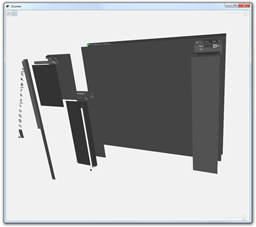
I don't use the Snoop zoomer often, but it has made life
marginally easier for me on some past projects.
Summary
I don't think you can go wrong with either of these applications
for your own projects.
WPF Inspector is looking to be another great application. It has
some real strengths. If Christian takes care of the issue finding
apps and inspecting them, it could be the next big thing for WPF
developers. This may only be an issue with special-case
applications anyway, but it's a consideration.
Snoop is still awesome for inspecting apps. It identifies more
applications that WPF Inspector and has the 3d visualization mode,
which really helps you understand the layering of a complex app.
It's also stable and has no issues with apps after launch. I'm sure
WPF Inspector will get there, but it's not quite there yet.
Oh, and unless you like your CPU being torn up, don't run both
visualizers at the same time. Individually, they had little to no
CPU impact. Together, they were causing Blend to hit 50-75%
CPU.
