I've written about some Silverlight work lately, but couldn't really talk about it until now.
Well, I can finally talk about it officially :)
The Silverlight 1.1 alpha Carbon Calculator that I and Steve Suing from Applied Information Sciences built was released into production last night, just in time for Live Earth. We're still doing a little bit of shake-out (and video editing and uploading), but it's out there, usable and fully functional, all on an alpha platform.
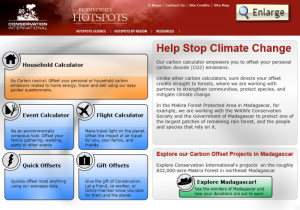
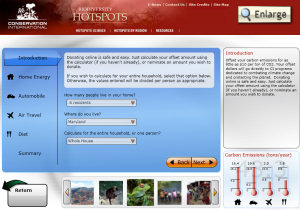
The Carbon Offset Calculator is a tool that calculates your impact on the environment, specifically your carbon dioxide output. This is affected by things such as the type and amount of energy in your home, your car and all the way down to the diet you eat. The science behind it is pretty solid, supported by government data.
There are a number of calculators out there, some in HTML/AJAX, some in Flash, some in plain old HTML with JavaScript. This is the first of its kind in Silverlight, though. It's also one of the first real production Silverlight 1.1 applications out there.
If you click on "Explore Madagascar" you can see how we also integrated Virtual Earth into the solution.
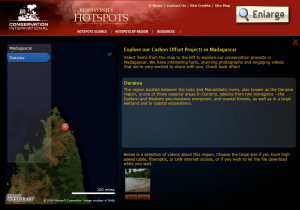
The colors could still use a little updating, as we scrambled at the last minute to restyle this for a white page. Originally it was all set up for a black page. The map page still uses the color scheme set up for the black page, as it really looks best that way.
I will blog later about a lot of the specific details of the implementation. In the mean time, here is some high-level information:
Some Details
Two developers, two months doing everything on the project except for coming up with the specific language to show up on the screens
Almost all test descriptions and calculator data is served up from various MOSS (SharePoint) lists
All filmstrip images come from MOSS
All videos are served up from MOSS
The geodata for the map points is also served up from MOSS
Silverlight is sitting over a layer holding the Virtual Earth map. We show and hide that layer as necessary. The shapes are placed on the map by converting lat/long data into real Silverlight coordinates.
The calculator itself is hosted in a regular old html page and surfaced via a page viewer web part (iframe) in a SharePoint page. This eliminated having to tackle building a web part on such a short project.
We couldn't pop up web pages using Silverlight, as popup blockers aren't yet aware of it like they are Flash. For that reason, the donation process takes over the iframe. This is far from ideal, but the best approach for now, as the donation pages change regularly.
Code Metrics
VS Analyzer doesn't yet understand agclr-hosted assemblies, so I did a quick count of files by hand (good old DIR /S), ignoring the test projects
The UI layer project has 87 XAML files, 93 .cs files and 5 .js files, not counting the sample silverlight controls I modified
The business layer project has 28 .cs files
The web service layer project has 38 .cs files and 2 .asmx files
Tools Used
Visual Studio Orcas Beta 1 for all development, and some xaml tweaking
Expression Blend 2 Beta for main UI design and some of the animations
Expression Design RTM for all vector graphics (everything in the UI except the backgrounds)
Expression Media Encoder Beta for the videos
Corel Paint Shop Pro Photo for raster graphics (I'll graduate to PhotoShop CS some day!)
All in all, while the project had a lot of long days, this was very enjoyable, and we both learned a ton. LINQ and the other .NET 3.5 additions were a great bonus to our learning on this project, and turned out to be extremely useful for navigating the objects we created from the SharePoint data.
Lamont Harrington at Microsoft (the person who owned this project on the Microsoft side) has a blog post that talks about some of the other bits he oversaw as part of this whole launch.
See it at BiodiversityHotspots.org . While you're at it, make a donation to a great cause!